")
Get a related visualization
URL: https://daac.ornl.gov/ABOVE/guides/Permafrost_Thaw_Depth_YK_fig1.png
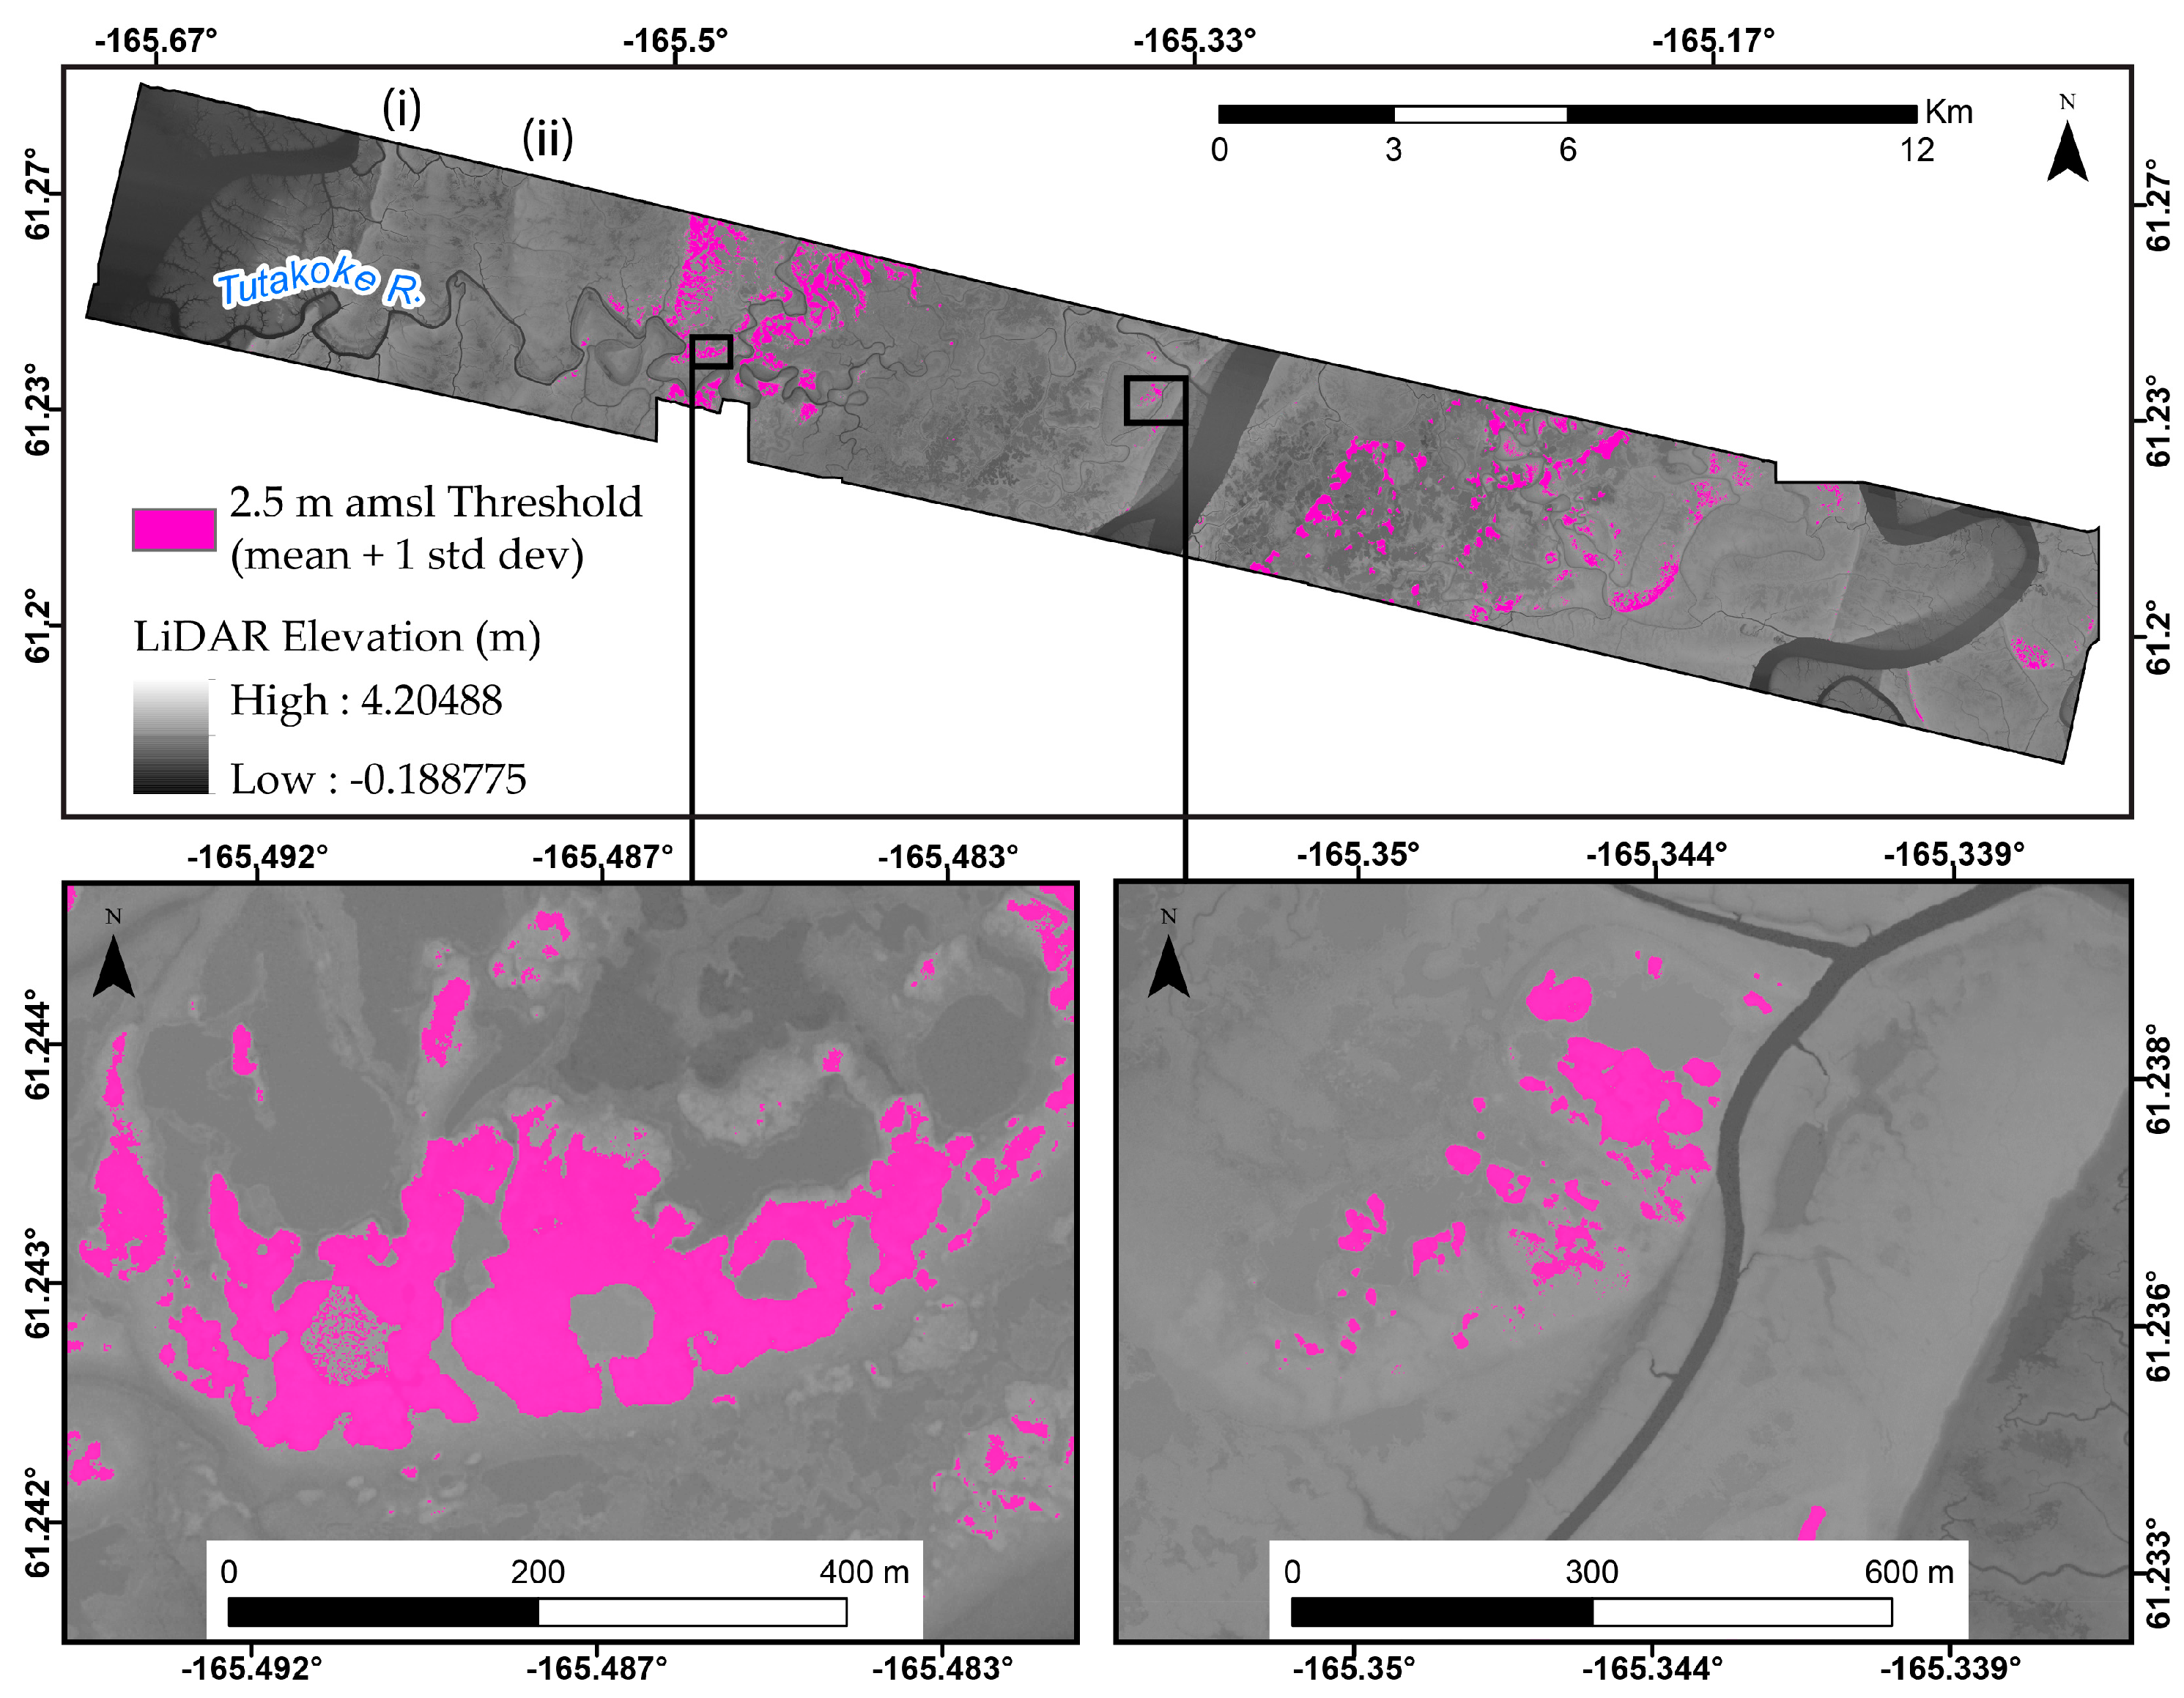
High-resolution map of permafrost distribution created using the 2.5 m a.m.s.l (mean + 1 SD) threshold for the entire 2009 LiDAR swath. The insets show detail for areas of high elevation (left) and relative low elevation (right) (Whitley et al., 2018).
Additional Information
| Field | Value |
|---|---|
| Data last updated | unknown |
| Metadata last updated | unknown |
| Created | unknown |
| Format | PNG |
| License | License not specified |
| Created | over 5 years ago |
| Media type | image/png |
| can be previewed | True |
| format | PNG |
| has views | True |
| id | c2b4f4f3-5fcb-4f84-b7c3-a229a35f6b3a |
| package id | 8fdf89d9-7909-4f68-a53c-9750ef00940f |
| position | 8 |
| revision id | 7a0ceaa3-00cd-4bbf-828d-6c55c099c36c |
| state | active |
| webstore last updated | None |
| webstore url | None |