Exaggerated (25x) Plume Density (CALIPSO) on 8/20/20 for the California Fires 2020
Date of Images:
August 20, 2020 at approximately 10:30 UTC
Summary:
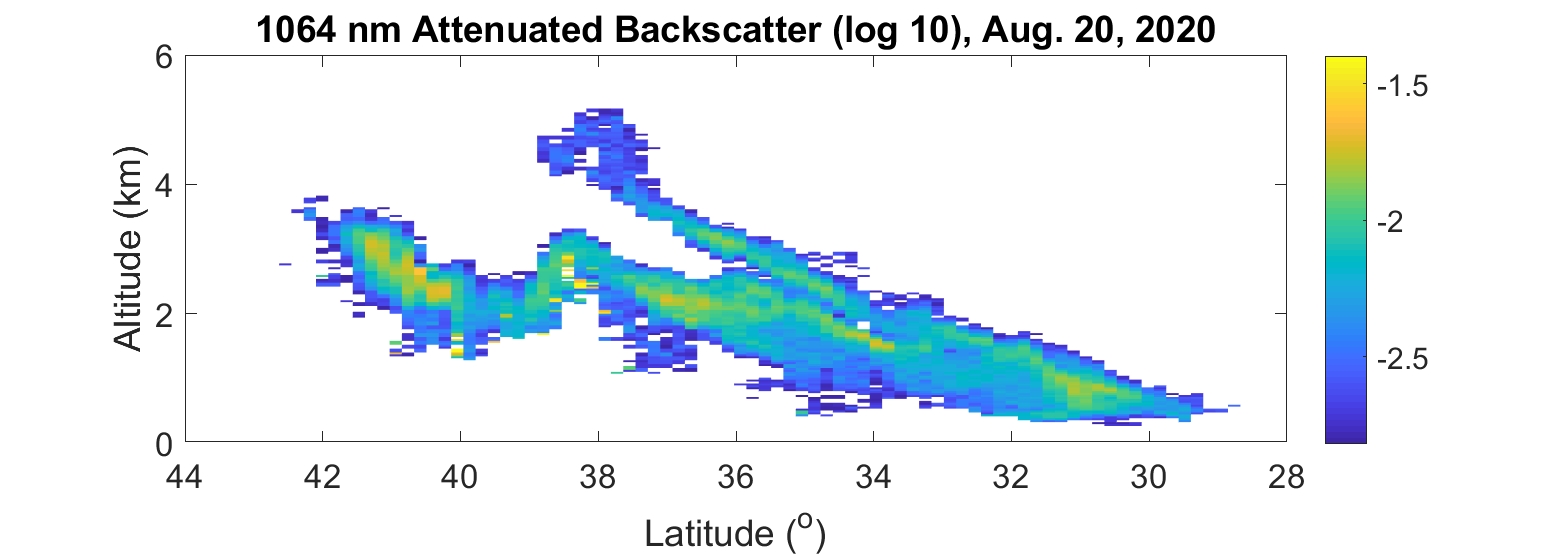
These images show the vertical distribution of wildfire smoke over the western United States as measured by the CALIOP lidar. The densest areas of the plume are confined within the lowest 4 km from the surface with top altitudes decreasing substantially as the smoke transports over the Pacific Ocean.
CALIOP measurements in these examples are vertical profiles of 1064 nm attenuated backscatter. Smoke observations have been manually identified based on CALIOP spectral and polarization measurements (increasing color ratio with penetration depth and low depolarization ratio are characteristic of smoke). The curtains are averaged to 20 km horizontal resolution to improve signal to noise ratio. In order to remove the molecular signal and reduce the contribution due to clouds, only attenuated backscatter measurements between 0.0015 and 0.04 km-1sr-1 are included. All measurements within 120 m of the surface are excluded to remove the surface return.
Suggested Use:
CALIOP measurements provide accurate measurements of the vertical distribution of smoke within the atmosphere. Lidar backscatter Log10 values are shown, ranging from -2.7 (light smoke) to -1.4 (dense smoke) using the colors shown in the graph below.
The lidar backscatter signal also includes contributions from clouds which appear as very strong returns. Users are recommended to consult CALIOP level 2 data products which provide feature typing information to aid in identification of smoke.
A full suite of CALIOP browse images for these cases can be accessed here:
8/20/20
https://www-calipso.larc.nasa.gov/products/lidar/browse_images/show_detail.php?s=production&v=V3-40&browse_date=2020-08-20&orbit_time=10-22-16&page=1&granule_name=CAL_LID_L1-ValStage1-V3-40.2020-08-20T10-22-16ZN.hdf
8/23/20
https://nasa.maps.arcgis.com/home/item.html?id=9b0da575f86a47e09ada04c4ce5edd81
https://www-calipso.larc.nasa.gov/products/lidar/browse_images/show_detail.php?s=expedited&v=V3-30&browse_date=2020-08-23&orbit_time=10-30-00&page=1&granule_name=CAL_LID_L1_Exp-Prov-V3-40.2020-08-23T10-30-00Z.hdf
Additional Passes not mapped in 3D due to low smoke detection:
8/28/20
https://www-calipso.larc.nasa.gov/products/lidar/browse_images/show_detail.php?s=expedited&v=V3-30&browse_date=2020-08-28&orbit_time=10-30-00&page=1&granule_name=CAL_LID_L1_Exp-Prov-V3-40.2020-08-28T10-30-00Z.hdf
8/28/20
https://www-calipso.larc.nasa.gov/products/lidar/browse_images/show_detail.php?s=expedited&v=V3-30&browse_date=2020-08-28&orbit_time=21-00-00&page=2&granule_name=CAL_LID_L1_Exp-Prov-V3-40.2020-08-28T21-00-00Z.hdf
Satellite/Sensor:
These measurements were made by the CALIOP lidar on board the CALIPSO satellite. CALIPSO is a partnership between NASA and the French space agency CNES. https://www-calipso.larc.nasa.gov/
Credits:
Jason Tackett, Jean-Paul Vernier, and Jay Kar of the CALIPSO Lidar Science Working Group.
Data and Resources
| Field | Value |
|---|---|
| dcat_issued | 2020-09-01T18:11:54.000Z |
| dcat_modified | 2021-08-18T20:57:48.000Z |
| dcat_publisher_name | NASA ArcGIS Online |
| guid | https://www.arcgis.com/home/item.html?id=3e3e5b4dc92c4008b5ba43c1967b63dd |
| Tags |
|
| isopen | False |
| metadata_created | 2025-09-18T18:26:02.037425 |
| metadata_modified | 2025-09-18T18:26:02.037433 |
| notes | <span style='font-weight:bold;'>Date of Images:</span><br />August 20, 2020 at approximately 10:30 UTC<br /><br /><span style='font-weight:bold;'>Summary:</span><br />These images show the vertical distribution of wildfire smoke over the western United States as measured by the CALIOP lidar. The densest areas of the plume are confined within the lowest 4 km from the surface with top altitudes decreasing substantially as the smoke transports over the Pacific Ocean. <br /><br />CALIOP measurements in these examples are vertical profiles of 1064 nm attenuated backscatter. Smoke observations have been manually identified based on CALIOP spectral and polarization measurements (increasing color ratio with penetration depth and low depolarization ratio are characteristic of smoke). The curtains are averaged to 20 km horizontal resolution to improve signal to noise ratio. In order to remove the molecular signal and reduce the contribution due to clouds, only attenuated backscatter measurements between 0.0015 and 0.04 km-1sr-1 are included. All measurements within 120 m of the surface are excluded to remove the surface return. <br /><br /><span style='font-weight:bold;'>Suggested Use:</span><br /><div>CALIOP measurements provide accurate measurements of the vertical distribution of smoke within the atmosphere. Lidar backscatter Log10 values are shown, ranging from -2.7 (light smoke) to -1.4 (dense smoke) using the colors shown in the graph below.<br /></div><div><br /></div><div>The lidar backscatter signal also includes contributions from clouds which appear as very strong returns. Users are recommended to consult CALIOP level 2 data products which provide feature typing information to aid in identification of smoke. <br /></div><div><br /></div><div><img alt='' src='https://maps.disasters.nasa.gov/download/metadata/caliop/20200820caliop.png' /></div><div><br /></div><div>A full suite of CALIOP browse images for these cases can be accessed here:</div><div><span style='font-weight:bold;'>8/20/20</span><br /></div><a href='https://www-calipso.larc.nasa.gov/products/lidar/browse_images/show_detail.php?s=production&v=V3-40&browse_date=2020-08-20&orbit_time=10-22-16&page=1&granule_name=CAL_LID_L1-ValStage1-V3-40.2020-08-20T10-22-16ZN.hdf' rel='nofollow ugc' target='_blank'>https://www-calipso.larc.nasa.gov/products/lidar/browse_images/show_detail.php?s=production&v=V3-40&browse_date=2020-08-20&orbit_time=10-22-16&page=1&granule_name=CAL_LID_L1-ValStage1-V3-40.2020-08-20T10-22-16ZN.hdf</a><div><br /></div><div><span style='font-weight:bold;'>8/23/20</span><br /></div><div><a href='https://nasa.maps.arcgis.com/home/item.html?id=9b0da575f86a47e09ada04c4ce5edd81' rel='nofollow ugc' target='_blank'>https://nasa.maps.arcgis.com/home/item.html?id=9b0da575f86a47e09ada04c4ce5edd81</a></div><div><a href='https://www-calipso.larc.nasa.gov/products/lidar/browse_images/show_detail.php?s=expedited&v=V3-30&browse_date=2020-08-23&orbit_time=10-30-00&page=1&granule_name=CAL_LID_L1_Exp-Prov-V3-40.2020-08-23T10-30-00Z.hdf' rel='nofollow ugc' target='_blank'>https://www-calipso.larc.nasa.gov/products/lidar/browse_images/show_detail.php?s=expedited&v=V3-30&browse_date=2020-08-23&orbit_time=10-30-00&page=1&granule_name=CAL_LID_L1_Exp-Prov-V3-40.2020-08-23T10-30-00Z.hdf</a></div><div><br /></div><div><span style='font-weight:bold;'>Additional Passes not mapped in 3D due to low smoke detection:</span></div><div><span style='font-weight:bold;'>8/28/20</span><br /></div><div><a href='https://www-calipso.larc.nasa.gov/products/lidar/browse_images/show_detail.php?s=expedited&v=V3-30&browse_date=2020-08-28&orbit_time=10-30-00&page=1&granule_name=CAL_LID_L1_Exp-Prov-V3-40.2020-08-28T10-30-00Z.hdf' rel='nofollow ugc' target='_blank'>https://www-calipso.larc.nasa.gov/products/lidar/browse_images/show_detail.php?s=expedited&v=V3-30&browse_date=2020-08-28&orbit_time=10-30-00&page=1&granule_name=CAL_LID_L1_Exp-Prov-V3-40.2020-08-28T10-30-00Z.hdf</a></div><div><br /></div><div><span style='font-weight:bold;'>8/28/20</span><br /></div><div><a href='https://www-calipso.larc.nasa.gov/products/lidar/browse_images/show_detail.php?s=expedited&v=V3-30&browse_date=2020-08-28&orbit_time=21-00-00&page=2&granule_name=CAL_LID_L1_Exp-Prov-V3-40.2020-08-28T21-00-00Z.hdf' rel='nofollow ugc' target='_blank'>https://www-calipso.larc.nasa.gov/products/lidar/browse_images/show_detail.php?s=expedited&v=V3-30&browse_date=2020-08-28&orbit_time=21-00-00&page=2&granule_name=CAL_LID_L1_Exp-Prov-V3-40.2020-08-28T21-00-00Z.hdf</a></div><div><br /></div><span style='font-weight:bold;'>Satellite/Sensor:</span><br />These measurements were made by the CALIOP lidar on board the CALIPSO satellite. CALIPSO is a partnership between NASA and the French space agency CNES. <a href='https://www-calipso.larc.nasa.gov/' rel='nofollow ugc' target='_blank'>https://www-calipso.larc.nasa.gov/</a><br /><br /><span style='font-weight:bold;'>Credits:</span><br />Jason Tackett, Jean-Paul Vernier, and Jay Kar of the CALIPSO Lidar Science Working Group. |
| num_resources | 2 |
| num_tags | 14 |
| title | Exaggerated (25x) Plume Density (CALIPSO) on 8/20/20 for the California Fires 2020 |
| url | https://disasters.amerigeoss.org/maps/NASA::exaggerated-25x-plume-density-calipso-on-8-20-20-for-the-california-fires-2020-1 |