Recent Global Earthquakes - Web Map
This displays recent earthquake information from the United States Geological Survey (USGS) Prompt Assessment of Global Earthquakes for Response (PAGER) program.
In addition to displaying earthquakes by magnitude, this web map also provides earthquake impact details. Impact is measured by population as well as models for economic and fatality loss. For more details, see: PAGER Alerts.
Events are updated as frequently as every 5 minutes and are available up to 30 days with the following exceptions:
The specific layers provided in this service have been Time Enabled and include:
This map is provided for informational purposes and is not monitored 24/7 for accuracy and currency. Always refer to USGS source for official guidance.
How to Use
This web map can be used for public information, awareness, and visualization of global earthquakes as a standalone map or embedded in ArcGIS Online apps and dashboards. Map pop-ups contain detailed event information which link individually to each event’s USGS page.
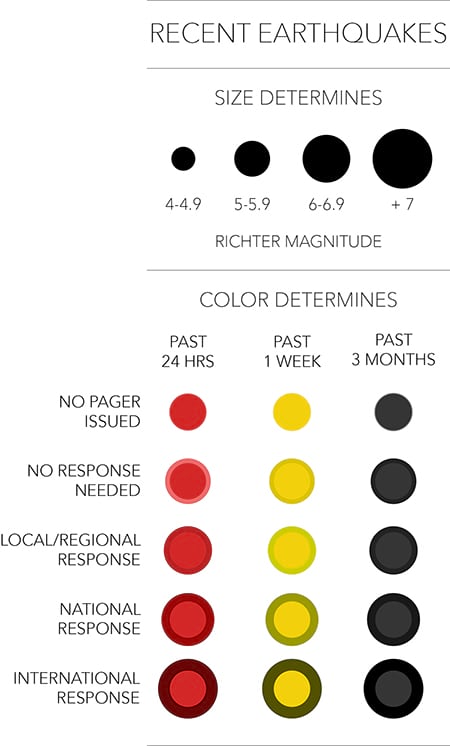
All events are derived from the same point data and are classified by an event’s Time (Past 24 hours, Past Week, and Past 3 Months), Magnitude (> 4.0 Richter Magnitude), and PAGER Alert Level.
The web app for this map is here.
Earthquake Mapping Part I: One Symbol from Multiple Fields in Arcade
Earthquake Mapping Part II: The Cartography of Time, Magnitude, and Alert Levels
In addition to displaying earthquakes by magnitude, this web map also provides earthquake impact details. Impact is measured by population as well as models for economic and fatality loss. For more details, see: PAGER Alerts.
Events are updated as frequently as every 5 minutes and are available up to 30 days with the following exceptions:
- Events with a Magnitude LESS than 3.0 are retained for 3 days
- Events with a Magnitude LESS than 4.5 are retained for 7 days
The specific layers provided in this service have been Time Enabled and include:
- Events by Magnitude: The event’s seismic magnitude value.
- Contains PAGER Alert Level: USGS PAGER (Prompt Assessment of Global Earthquakes for Response) system provides an automated impact level assignment that estimates fatality and economic loss.
- Contains Significance Level: An event’s significance is determined by factors like magnitude, max MMI, ‘felt’ reports, and estimated impact.
- Shake Intensity: The Instrumental Intensity or Modified Mercalli Intensity (MMI) for available events.
This map is provided for informational purposes and is not monitored 24/7 for accuracy and currency. Always refer to USGS source for official guidance.
How to Use
This web map can be used for public information, awareness, and visualization of global earthquakes as a standalone map or embedded in ArcGIS Online apps and dashboards. Map pop-ups contain detailed event information which link individually to each event’s USGS page.
All events are derived from the same point data and are classified by an event’s Time (Past 24 hours, Past Week, and Past 3 Months), Magnitude (> 4.0 Richter Magnitude), and PAGER Alert Level.
The web app for this map is here.
Earthquake Mapping Part I: One Symbol from Multiple Fields in Arcade
Earthquake Mapping Part II: The Cartography of Time, Magnitude, and Alert Levels
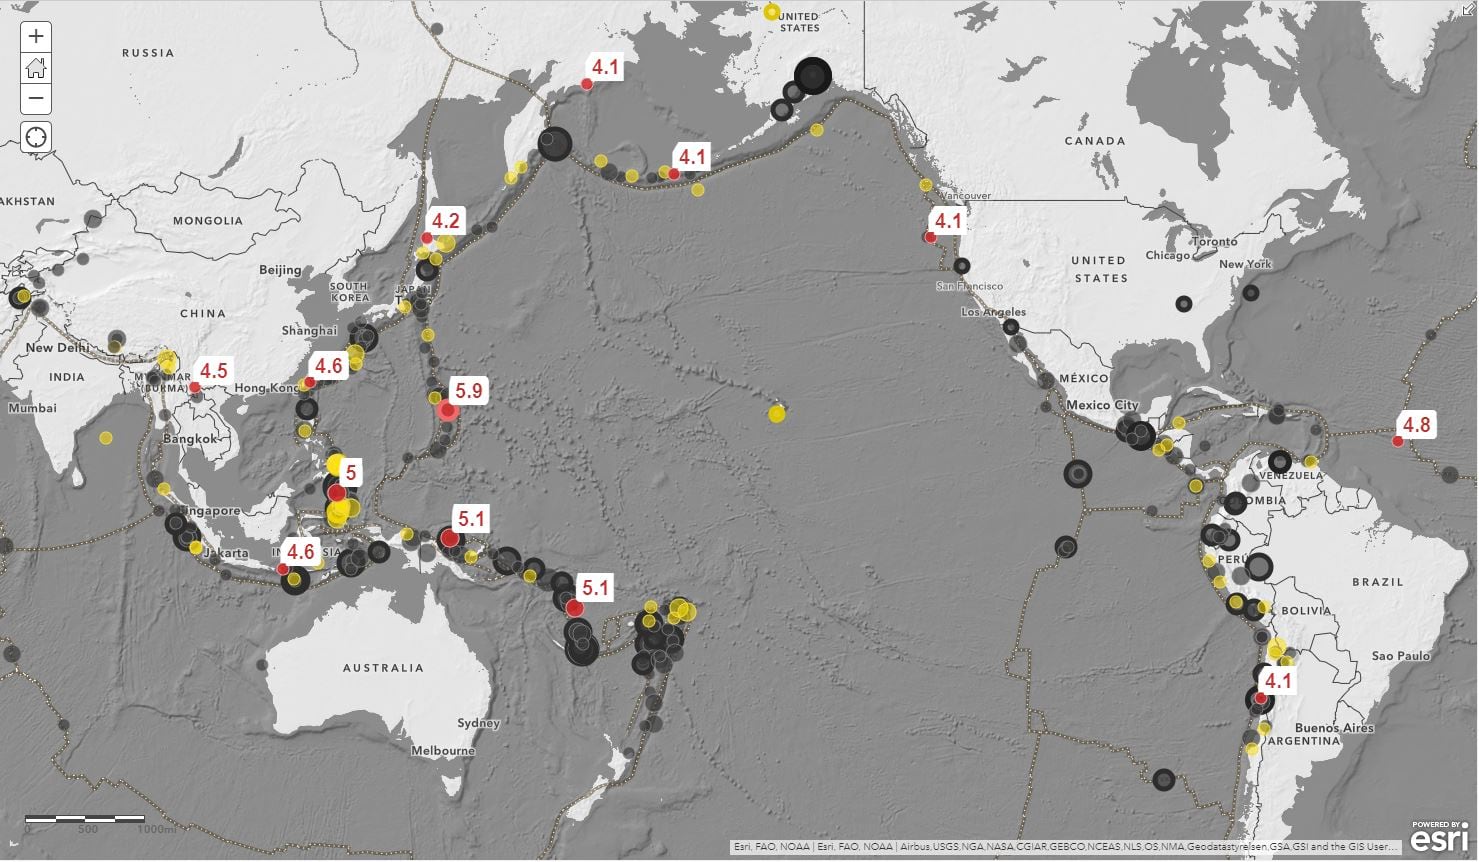
Light Basemap:
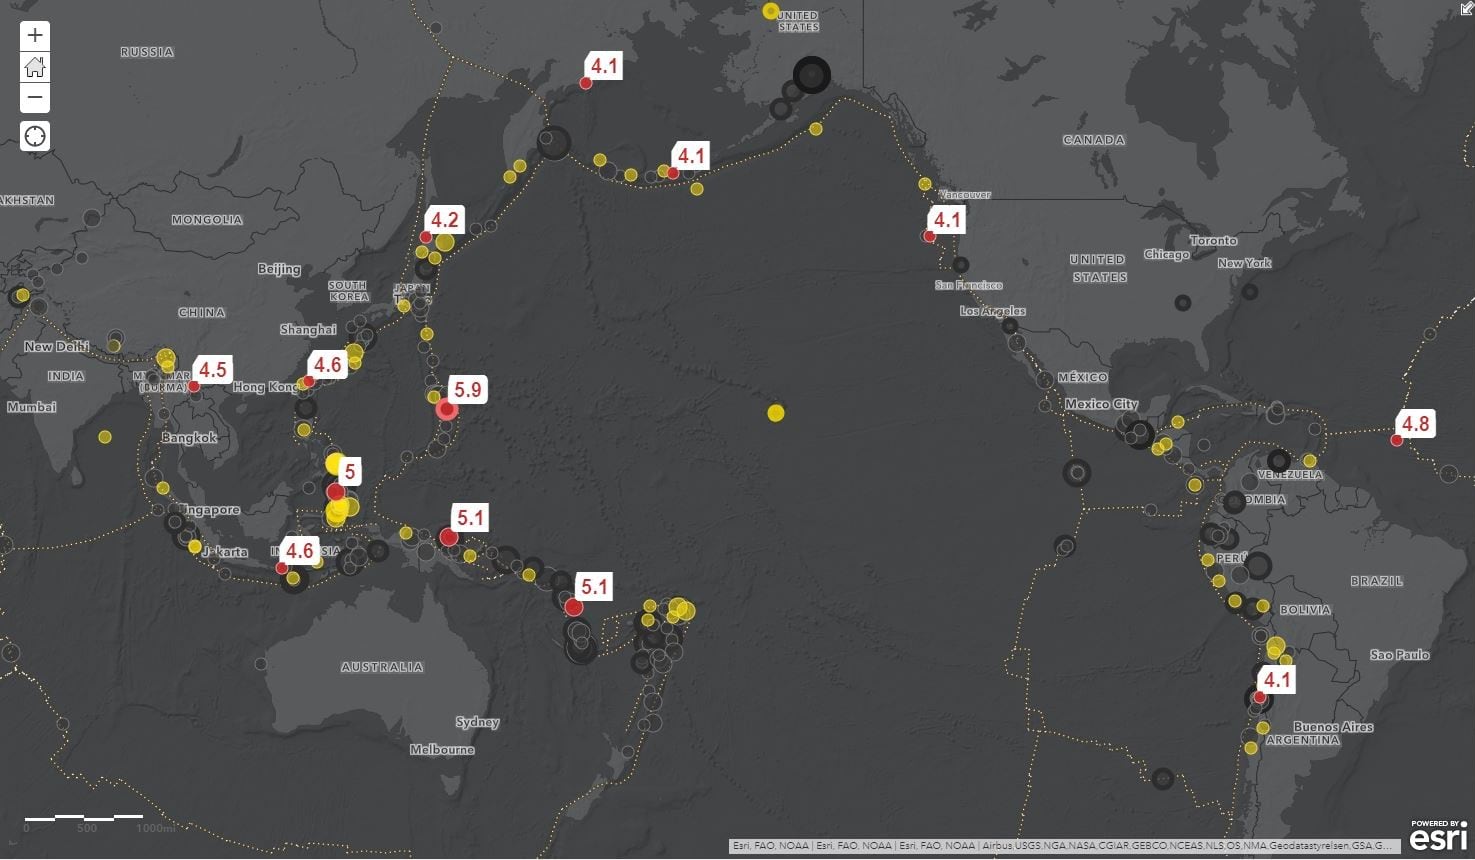
Dark Basemap
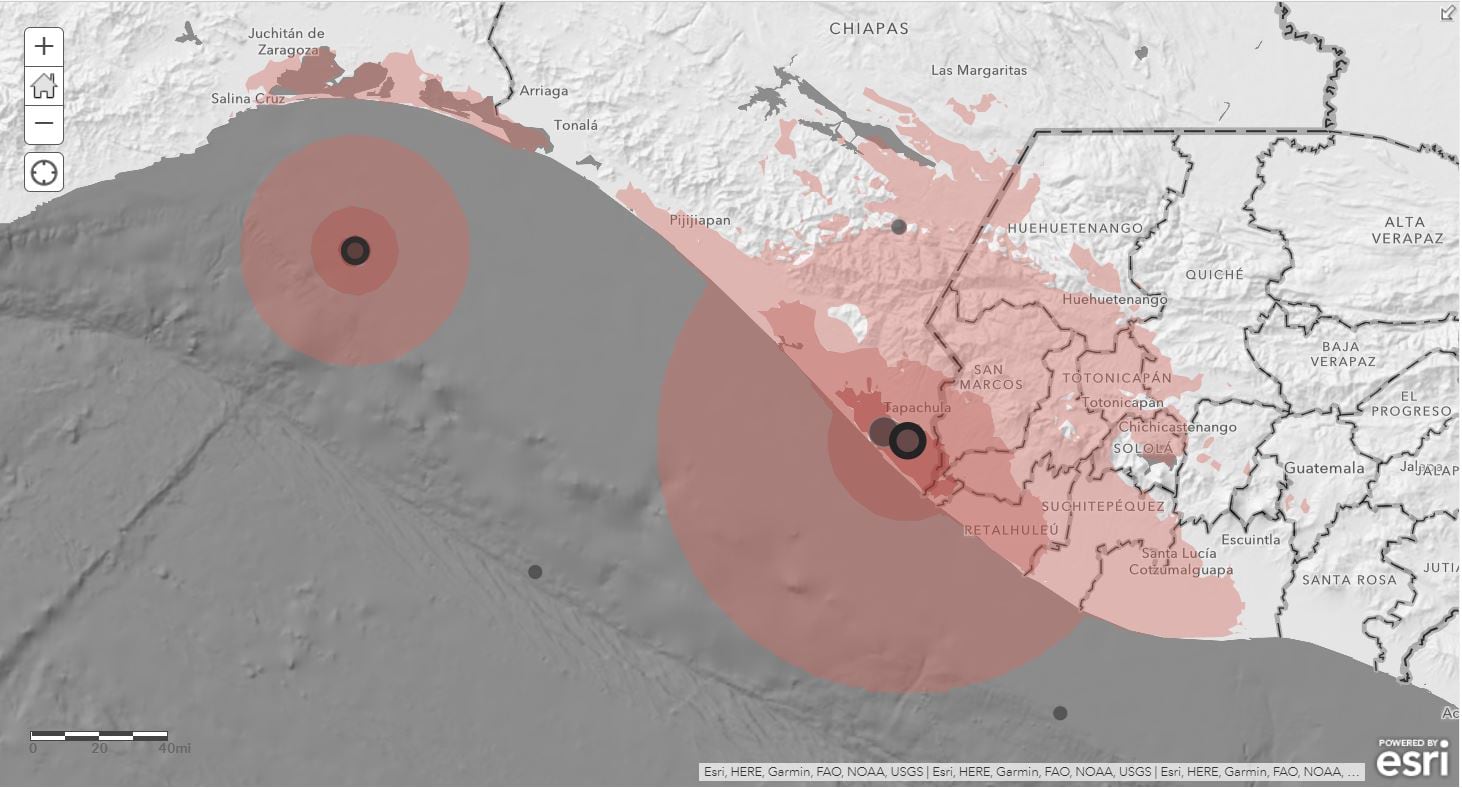
The shakemaps have been dissolved by a unique value and ordered so that the most intense shaking appears on top. This is achieved by using symbol level drawing.
Shake Map
Data and Resources
| Field | Value |
|---|---|
| dcat_issued | 2020-02-13T21:15:38.000Z |
| dcat_modified | 2022-02-16T20:22:47.000Z |
| dcat_publisher_name | ArcGIS Living Atlas Team |
| guid | https://www.arcgis.com/home/item.html?id=c85b477ca58a4b968fc3ce1878b0b564 |
| Tags |
|
| isopen | False |
| metadata_created | 2026-08-20T14:56:59.097065 |
| metadata_modified | 2026-08-20T14:56:59.097072 |
| notes | <div><div><span style='font-variant-numeric:normal; font-variant-east-asian:normal;'><font size='3'>This displays recent earthquake information from the <a href='https://earthquake.usgs.gov/data/pager/' target='_blank' rel='nofollow ugc noopener noreferrer'>United States Geological Survey (USGS) Prompt Assessment of Global Earthquakes for Response (PAGER)</a> program.</font></span></div><div><span style='font-variant-numeric:normal; font-variant-east-asian:normal;'><font size='3'><br /></font></span></div><div><span style='font-family:"Avenir Next W01", "Avenir Next W00", "Avenir Next", Avenir, "Helvetica Neue", sans-serif; font-size:16px;'>In addition to displaying earthquakes by magnitude, this web map also provides earthquake impact details. Impact is measured by population as well as models for economic and fatality loss. For more details, see: </span><a href='https://earthquake.usgs.gov/earthquakes/pager' style='color:rgb(0, 121, 193); text-decoration-line:none; font-family:"Avenir Next W01", "Avenir Next W00", "Avenir Next", Avenir, "Helvetica Neue", sans-serif; font-size:16px;' target='_blank' rel='nofollow ugc noopener noreferrer'>PAGER Alerts</a><span style='font-family:"Avenir Next W01", "Avenir Next W00", "Avenir Next", Avenir, "Helvetica Neue", sans-serif; font-size:16px;'>.</span><br /></div><div><span style='font-family:"Avenir Next W01", "Avenir Next W00", "Avenir Next", Avenir, "Helvetica Neue", sans-serif;'><font size='3'><br /></font></span></div><div><font size='3'><span style='font-family:"Avenir Next W01", "Avenir Next W00", "Avenir Next", Avenir, "Helvetica Neue", sans-serif;'>Events are updated as frequently as every 5 minutes and are available up to 30 days with the following exceptions:</span><br /></font><ul><li><font size='3'>Events with a Magnitude LESS than 3.0 are retained for 3 days</font></li><li><font size='3'>Events with a Magnitude LESS than 4.5 are retained for 7 days</font></li></ul><font size='3'><span style='font-family:"Avenir Next W01", "Avenir Next W00", "Avenir Next", Avenir, "Helvetica Neue", sans-serif;'>In addition to event points, ShakeMaps are also provided. These have been dissolved by Shake Intensity to reduce the Layer Complexity.</span><br /><br /><span style='font-family:"Avenir Next W01", "Avenir Next W00", "Avenir Next", Avenir, "Helvetica Neue", sans-serif;'>The specific layers provided in this service have been Time Enabled and include:</span></font><ul><li><font size='3'><b>Events by Magnitude:</b> The event’s seismic magnitude value.</font></li><ul><li><font size='3'><b>Contains PAGER Alert Level:</b> USGS PAGER (Prompt Assessment of Global Earthquakes for Response) system provides an automated impact level assignment that estimates fatality and economic loss.</font></li><li><font size='3'><b>Contains Significance Level:</b> An event’s significance is determined by factors like magnitude, max MMI, ‘felt’ reports, and estimated impact.</font></li></ul><li><font size='3'><b>Shake Intensity:</b> The Instrumental Intensity or Modified Mercalli Intensity (MMI) for available events.</font></li></ul><div style='font-family:"Avenir Next W01", "Avenir Next W00", "Avenir Next", Avenir, "Helvetica Neue", sans-serif;'><font size='3'>For field terms and technical details, see: <a href='https://earthquake.usgs.gov/data/comcat/data-eventterms.php' style='color:rgb(0, 121, 193); text-decoration-line:none; font-family:inherit;' target='_blank' rel='nofollow ugc noopener noreferrer'>ComCat Documentation</a></font></div><div style='font-family:"Avenir Next W01", "Avenir Next W00", "Avenir Next", Avenir, "Helvetica Neue", sans-serif;'><font size='3'><br /></font></div><div style='font-family:"Avenir Next W01", "Avenir Next W00", "Avenir Next", Avenir, "Helvetica Neue", sans-serif;'><span style='font-family:inherit;'><font size='3'><font color='#000000'>This map is provided for informational purposes and is not monitored 24/7 for accuracy and currency. Always refer to </font><a href='https://www.usgs.gov/natural-hazards/earthquake-hazards/earthquakes' style='color:rgb(0, 121, 193); text-decoration-line:none; font-family:inherit;' target='_blank' rel='nofollow ugc noopener noreferrer'>USGS</a><font color='#000000'> source for official guidance.</font></font></span></div></div><div style='font-family:"Avenir Next W01", "Avenir Next W00", "Avenir Next", Avenir, "Helvetica Neue", sans-serif;'><span style='font-family:inherit;'><font size='3'><font color='#000000'><br /></font></font></span></div><div style='font-family:"Avenir Next W01", "Avenir Next W00", "Avenir Next", Avenir, "Helvetica Neue", sans-serif;'><span style='font-size:x-large;'>How to Use</span><span style='font-family:inherit;'><font size='3'><font color='#000000'><br /></font></font></span></div><div><span style='font-variant-numeric:normal; font-variant-east-asian:normal;'><font size='3'><br /></font></span></div><div><span style='font-variant-numeric:normal; font-variant-east-asian:normal;'><font color='#000000' size='3'>This web map can be used for public information, awareness, and visualization of global earthquakes as a standalone map or embedded in ArcGIS Online apps and dashboards. Map pop-ups contain detailed event information which link individually to each event’s USGS page.</font></span></div></div><div><span style='font-variant-numeric:normal; font-variant-east-asian:normal;'><font size='3'><div><br /></div><div>All events are derived from the same point data and are classified by an event’s Time (Past 24 hours, Past Week, and Past 3 Months), Magnitude (> 4.0 Richter Magnitude), and PAGER Alert Level.</div><div><br /></div><div>The web app for this map is <a href='https://www.arcgis.com/home/item.html?id=e80b4637b2c84c98a1030cebcdd61941' target='_blank' rel='nofollow ugc noopener noreferrer'>here</a>.</div></font></span></div><div><span><font size='3'><p style='margin-top:0pt; margin-bottom:0pt;'><br /></p><div>There are two articles that walk through this app in greater detail:</div><div><br /></div><div><a href='https://www.esri.com/arcgis-blog/products/arcgis-living-atlas/mapping/one-symbol-from-multiple-fields-in-arcade/' target='_blank' rel='nofollow ugc noopener noreferrer'>Earthquake Mapping Part I: One Symbol from Multiple Fields in Arcade</a><br /></div><div><a href='https://www.esri.com/arcgis-blog/products/arcgis-living-atlas/mapping/the-cartography-of-time-magnitude-and-alert-levels/' target='_blank' rel='nofollow ugc noopener noreferrer'>Earthquake Mapping Part II: The Cartography of Time, Magnitude, and Alert Levels</a></div></font></span><span><p style='margin-top:0pt; margin-bottom:0pt;'><font size='3'><br /></font></p><p style='margin-top:0pt; margin-bottom:0pt;'><font size='3'><br /></font></p><p style='margin-top:0pt; margin-bottom:0pt;'><font size='3'><img src='https://www.esri.com/arcgis-blog/wp-content/uploads/2019/01/eem_18_earthquakes194.jpg' /><br /></font></p><p style='margin-top:0pt; margin-bottom:0pt;'><font size='3'><br /></font></p><p style='margin-top:0pt; margin-bottom:0pt;'><font size='3'><span style='font-family:Arial;'>Light Basemap:</span><br /></font></p><p style='margin-top:0pt; margin-bottom:0pt;'><span style='font-family:Arial;'><font size='3'><br /></font></span></p><p style='margin-top:0pt; margin-bottom:0pt;'><span style='font-family:Arial; font-variant-numeric:normal; font-variant-east-asian:normal;'><font size='3'><img src='https://www.esri.com/arcgis-blog/wp-content/uploads/2019/01/eem_18_earthquakes201.jpg' /><br /></font></span></p><p style='margin-top:0pt; margin-bottom:0pt;'><font size='3'><br /></font></p><p style='margin-top:0pt; margin-bottom:0pt;'><span style='font-family:Arial; font-variant-numeric:normal; font-variant-east-asian:normal;'><font size='3'>Dark Basemap</font></span></p><p style='margin-top:0pt; margin-bottom:0pt;'><span style='font-family:Arial; font-variant-numeric:normal; font-variant-east-asian:normal;'><font size='3'><br /></font></span></p><p style='margin-top:0pt; margin-bottom:0pt;'><font size='3'><img src='https://www.esri.com/arcgis-blog/wp-content/uploads/2019/01/eem_18_earthquakes206.jpg' /><br /></font></p><div><span style='font-variant-numeric:normal; font-variant-east-asian:normal;'><p style='font-family:Arial; margin-top:0pt; margin-bottom:0pt;'><span style='font-family:Arial; color:rgb(76, 76, 76); background-color:rgb(255, 255, 255); font-weight:400; font-style:normal; font-variant:normal; text-decoration:none;'><font size='3'><br /></font></span></p><p style='font-family:Arial; margin-top:0pt; margin-bottom:0pt;'><font size='3'><span style='font-variant-numeric:normal; font-variant-east-asian:normal;'>The shakemaps have been dissolved by a unique value and ordered so that the most intense shaking appears on top. This is achieved by using </span><span style='font-variant-numeric:normal; font-variant-east-asian:normal;'><a href='https://resources.arcgis.com/en/help/main/10.2/index.html#//00s500000039000000' target='_blank' rel='nofollow ugc noopener noreferrer'>symbol level drawing</a>.</span><br /></font></p><p style='font-family:Arial; margin-top:0pt; margin-bottom:0pt;'><b><font size='3'><br /></font></b></p><p style='font-family:Arial; margin-top:0pt; margin-bottom:0pt;'><span style='font-family:Arial; color:rgb(76, 76, 76); background-color:rgb(255, 255, 255); font-weight:400; font-style:normal; font-variant:normal; text-decoration:none;'><font size='3'>Shake Map</font></span></p><p style='font-family:Arial; margin-top:0pt; margin-bottom:0pt;'><span style='font-family:Arial; color:rgb(76, 76, 76); background-color:rgb(255, 255, 255); font-weight:400; font-style:normal; font-variant:normal; text-decoration:none;'><font size='3'><br /></font></span></p><p style='font-family:Arial; margin-top:0pt; margin-bottom:0pt;'><font size='3'><img src='https://www.esri.com/arcgis-blog/wp-content/uploads/2019/02/eem_18_earthquakes213.jpg' /><br /></font></p><p style='margin-top:0pt; margin-bottom:0pt;'><font size='3'><img src='https://arcg.is/0KXiuj' /><br /></font></p><p style='font-family:Arial; margin-top:0pt; margin-bottom:0pt;'><font size='3'><br /></font><br /></p></span></div></span></div> |
| num_resources | 1 |
| num_tags | 9 |
| title | Recent Global Earthquakes - Web Map |
| url | https://www.caribbeangeoportal.com/maps/arcgis-content::recent-global-earthquakes-web-map-1 |